Year
2021
Designing a management system for outdoor lighting that helps save energy and reduce maintenance costs.
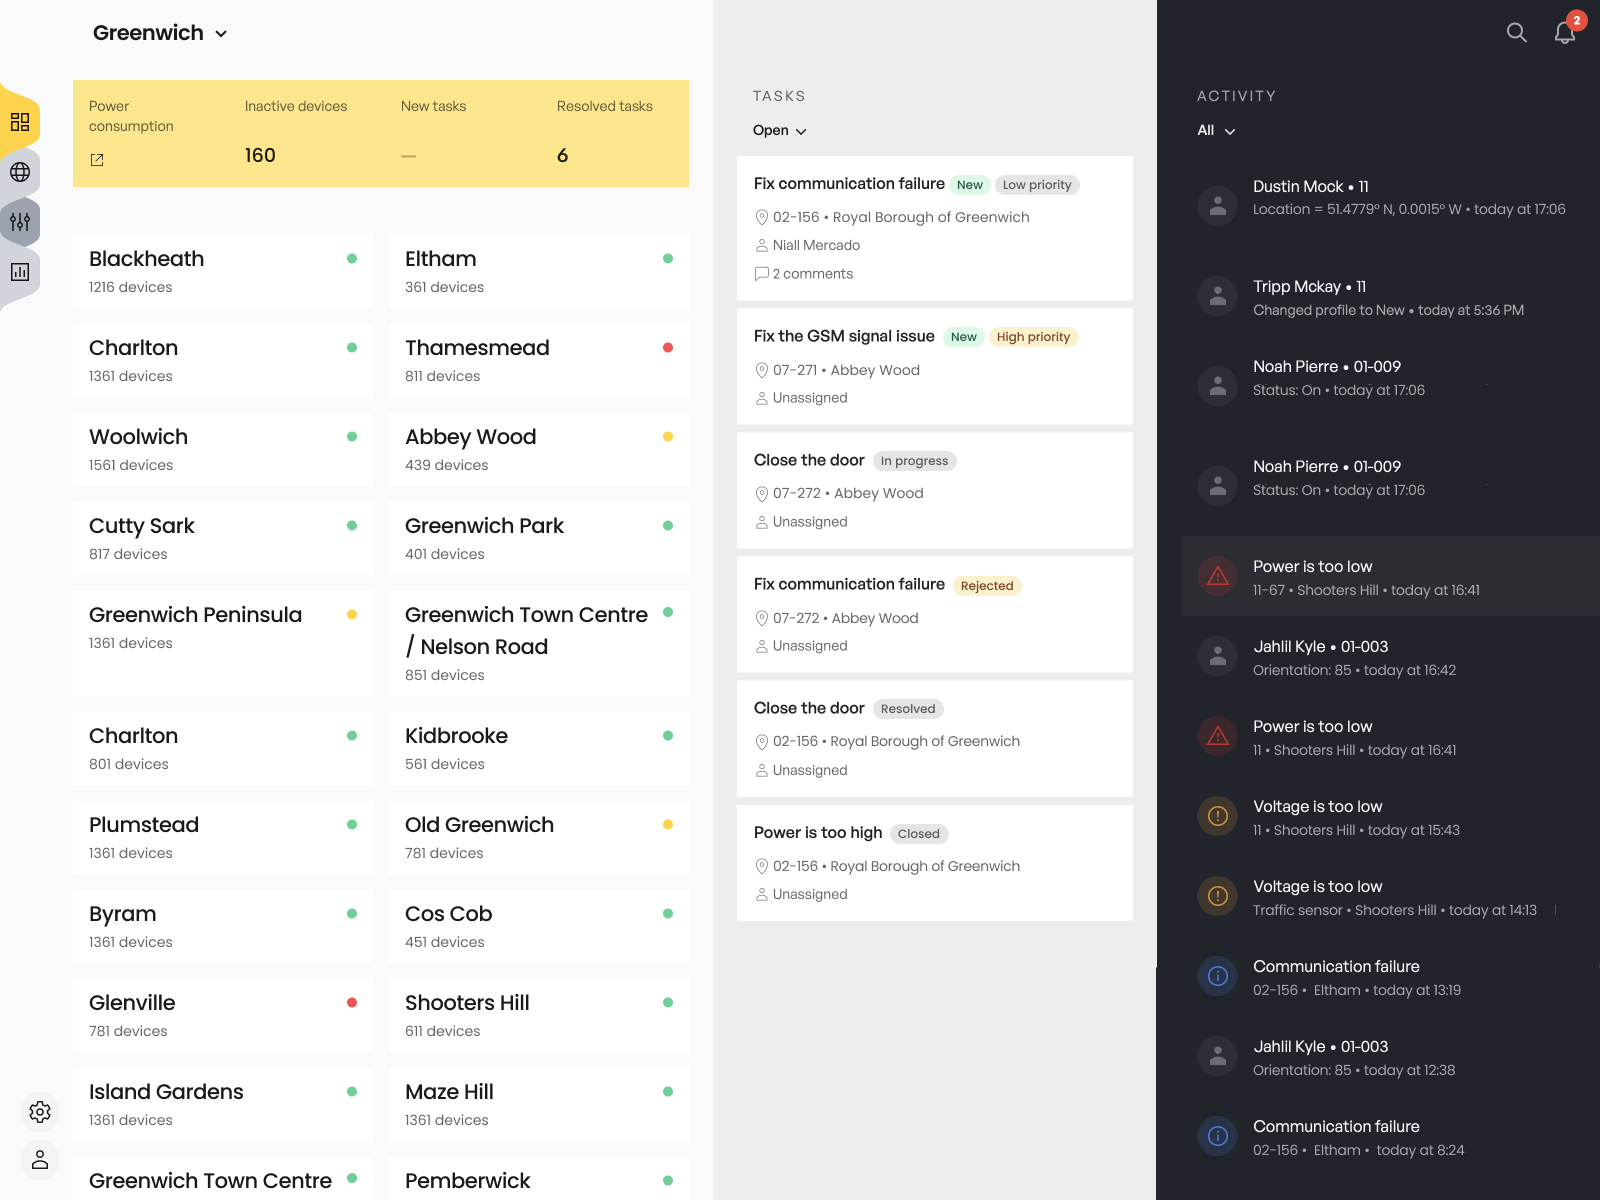
Developing clear visual representations of system status, energy usage, and maintenance needs that enable quick decision-making.
Designing notification systems that highlight critical issues without causing alert fatigue.
Ensuring the system works effectively across devices for field technicians.
Mapping and streamlining maintenance processes to reduce response times and simplify routine tasks.
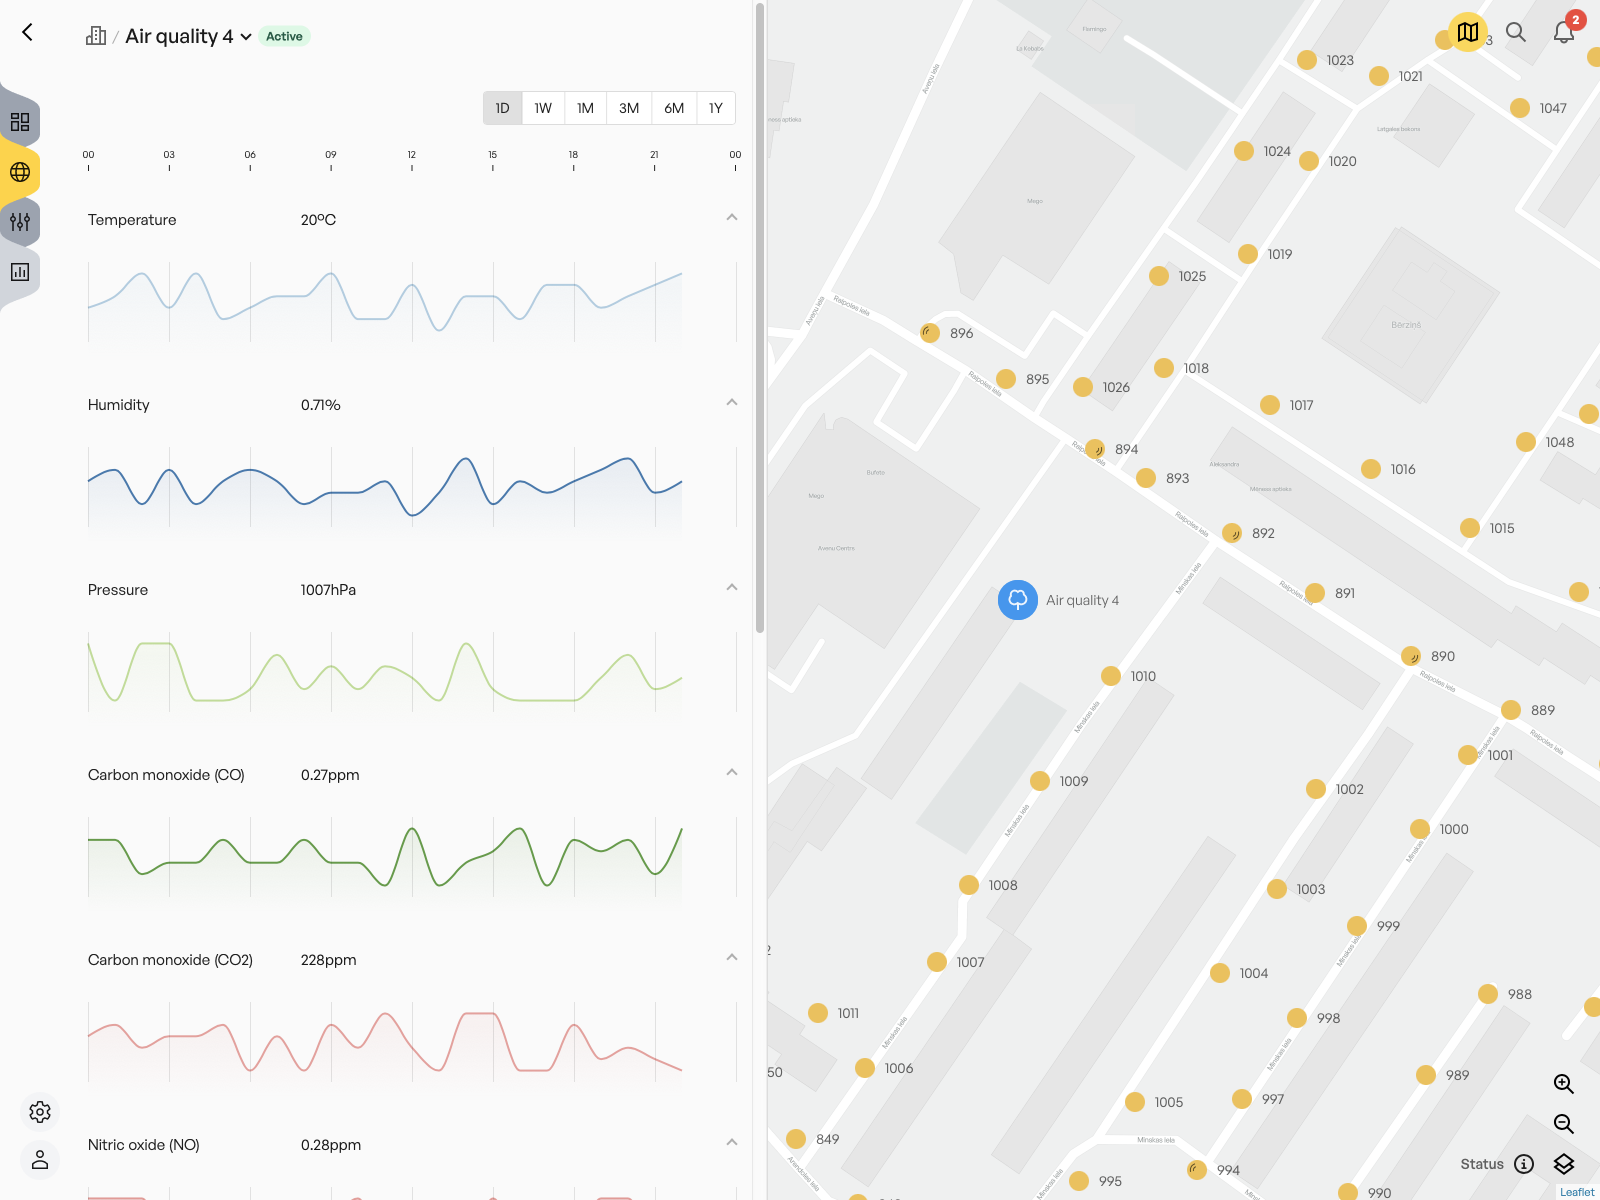
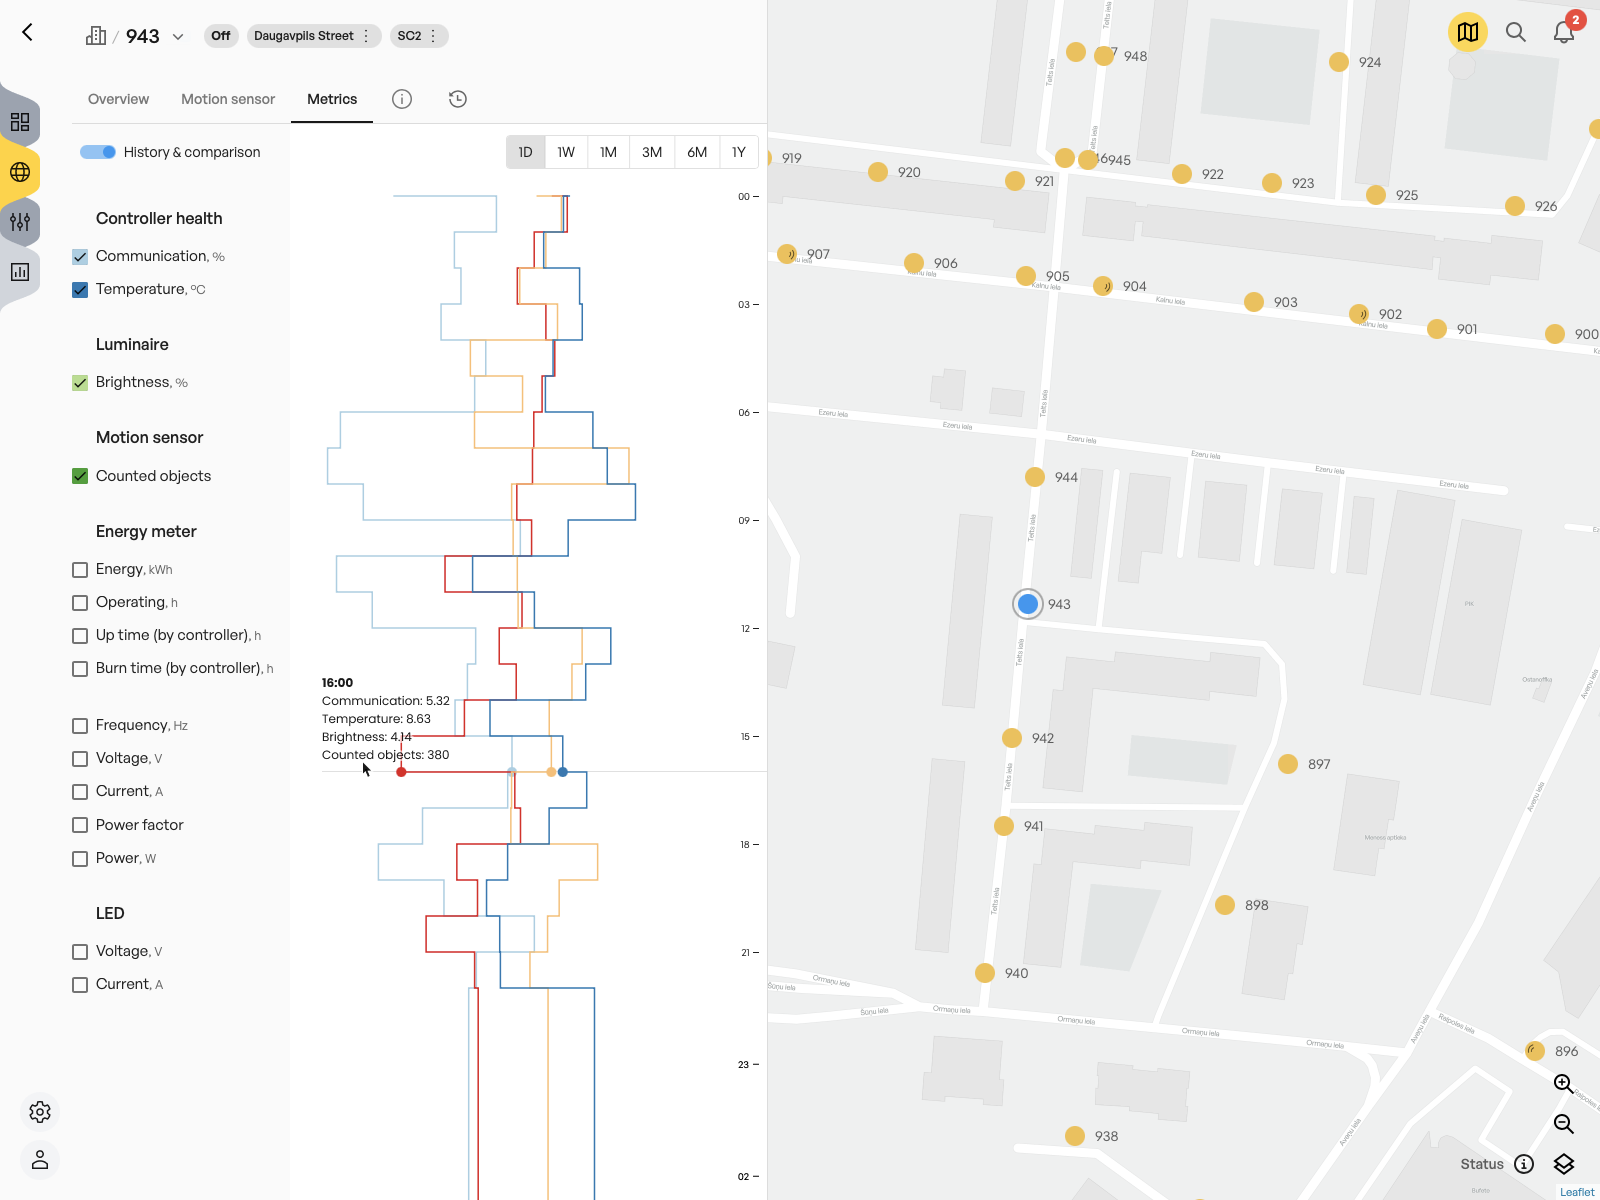
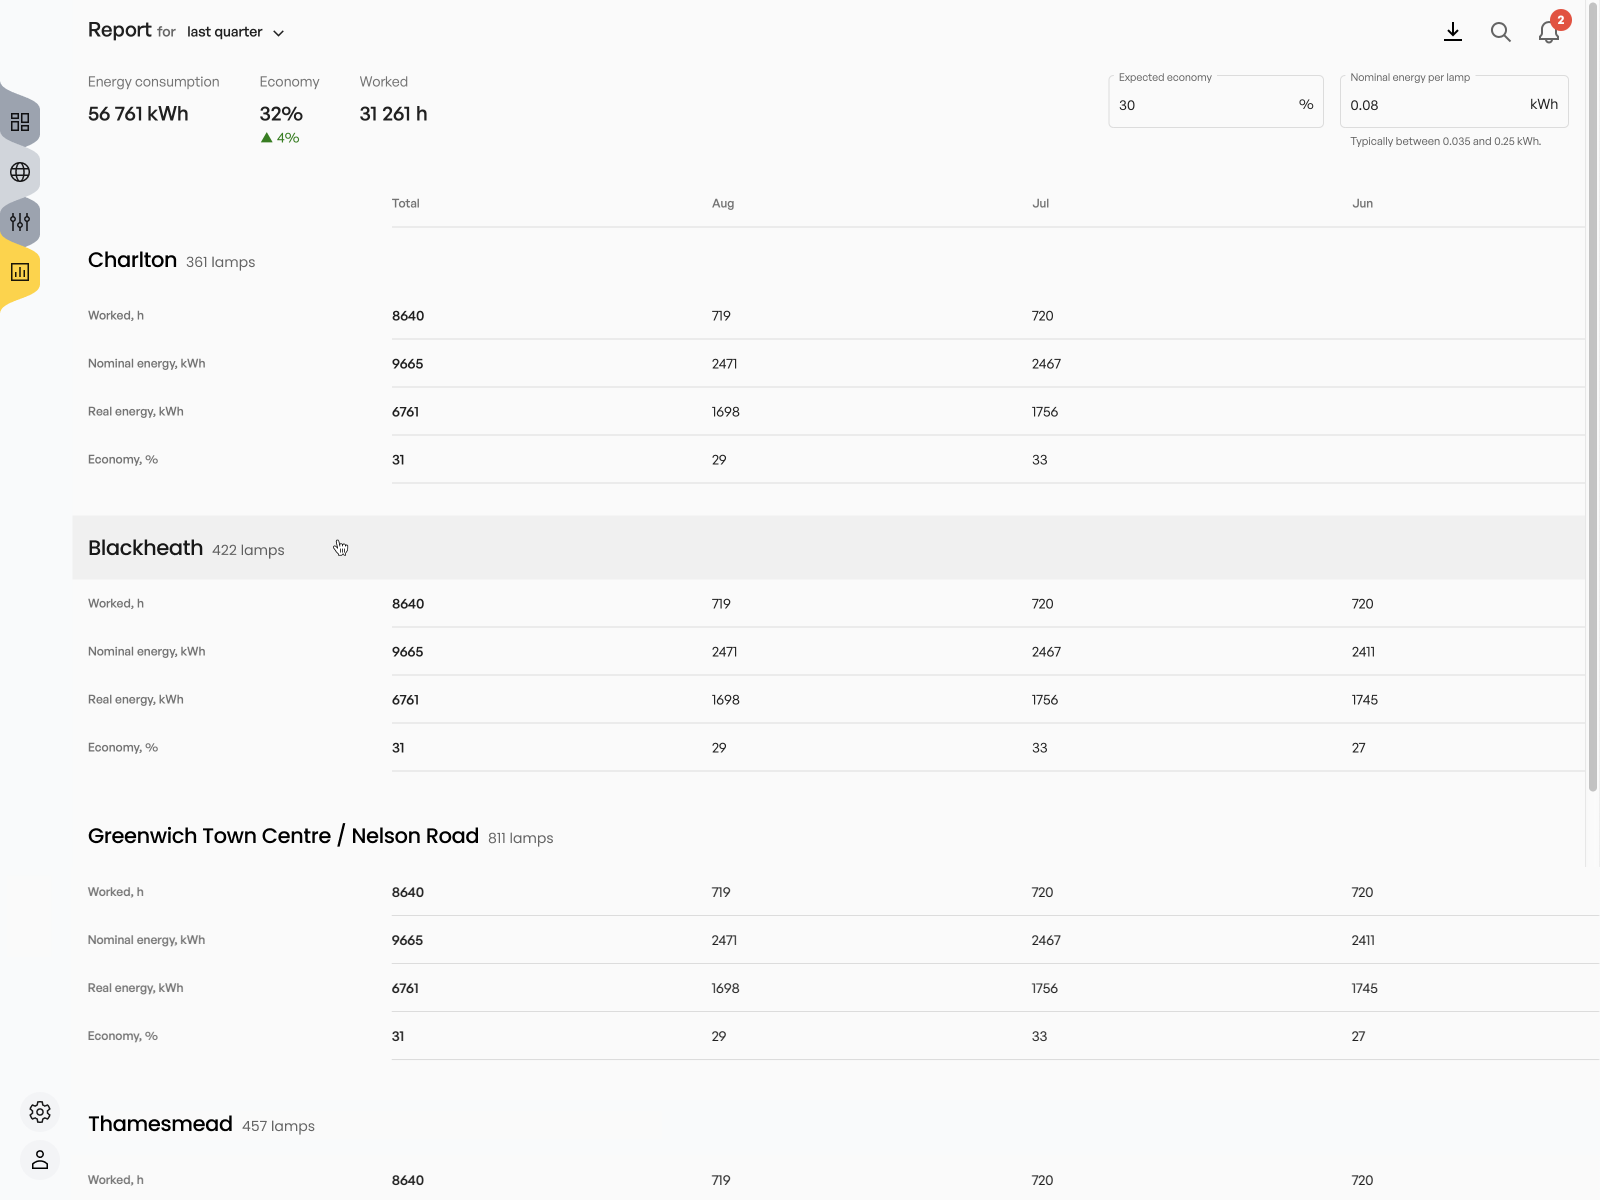
Reports on lighting usage, energy consumption, and environmental conditions to inform decision-making.
Suitable for use in cities of different sizes: from towns to metropolitan areas.
People who work with the system directly.
Optimise city lighting for energy efficiency, cost savings, and enhanced public safety.
Ensure the lighting infrastructure is functional and well-maintained.
Perform repairs.
People who set the goals of the system and/or depend on it in some ways.
Integrate smart lighting with broader urban design projects.
Minimize environmental impact and promote sustainability.
Benefit from improved lighting for safety, convenience, and quality of life.
Develop and implement policies that leverage smart lighting for broader city benefits.
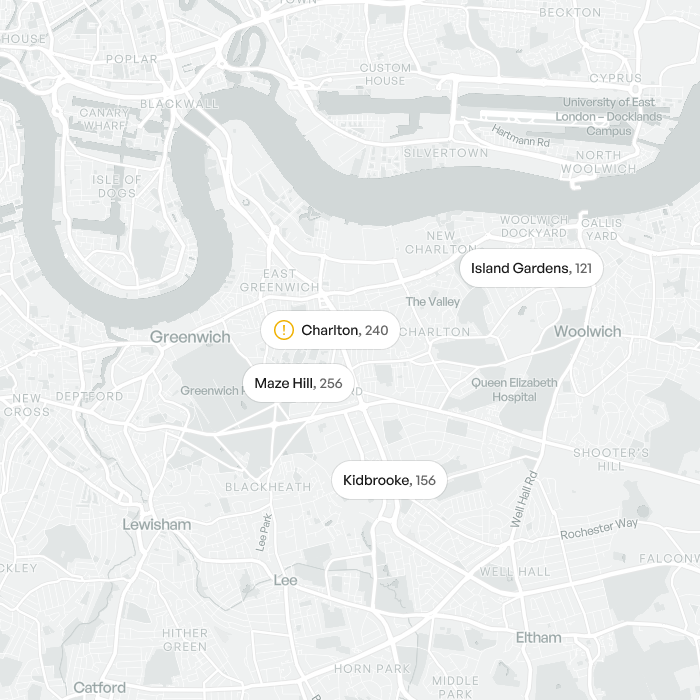
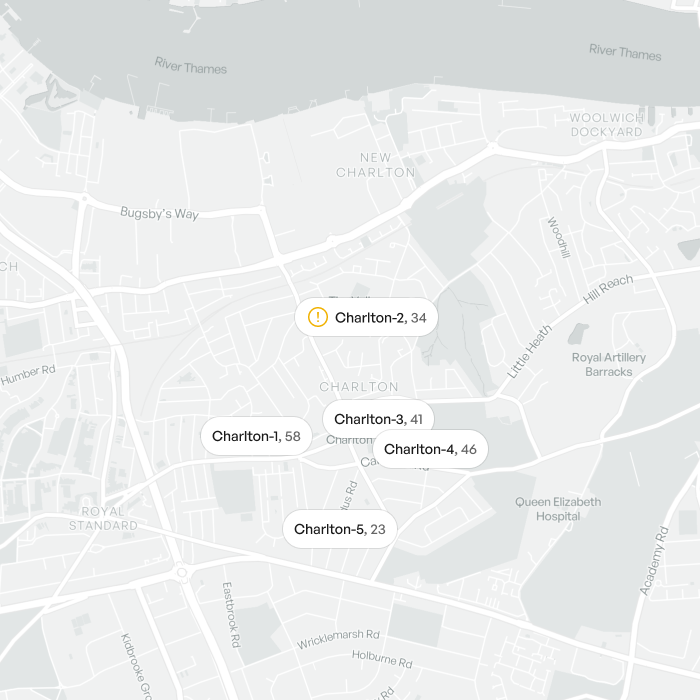
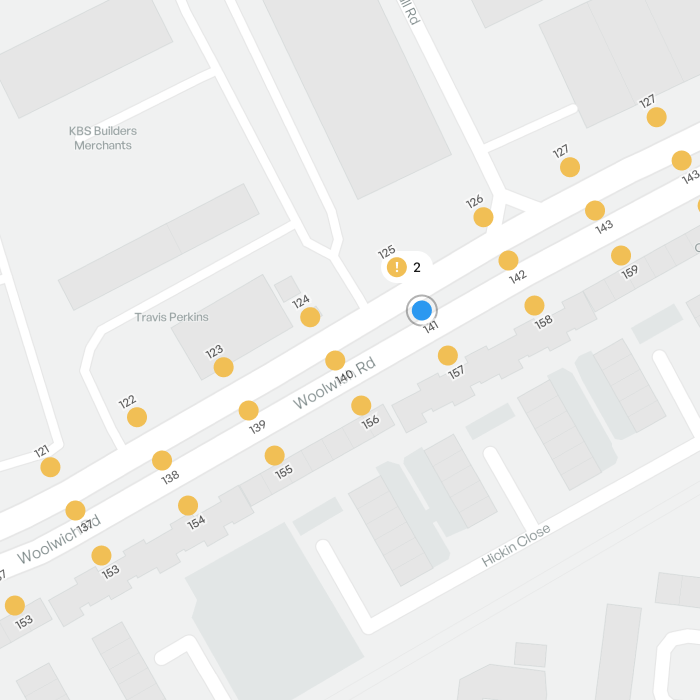
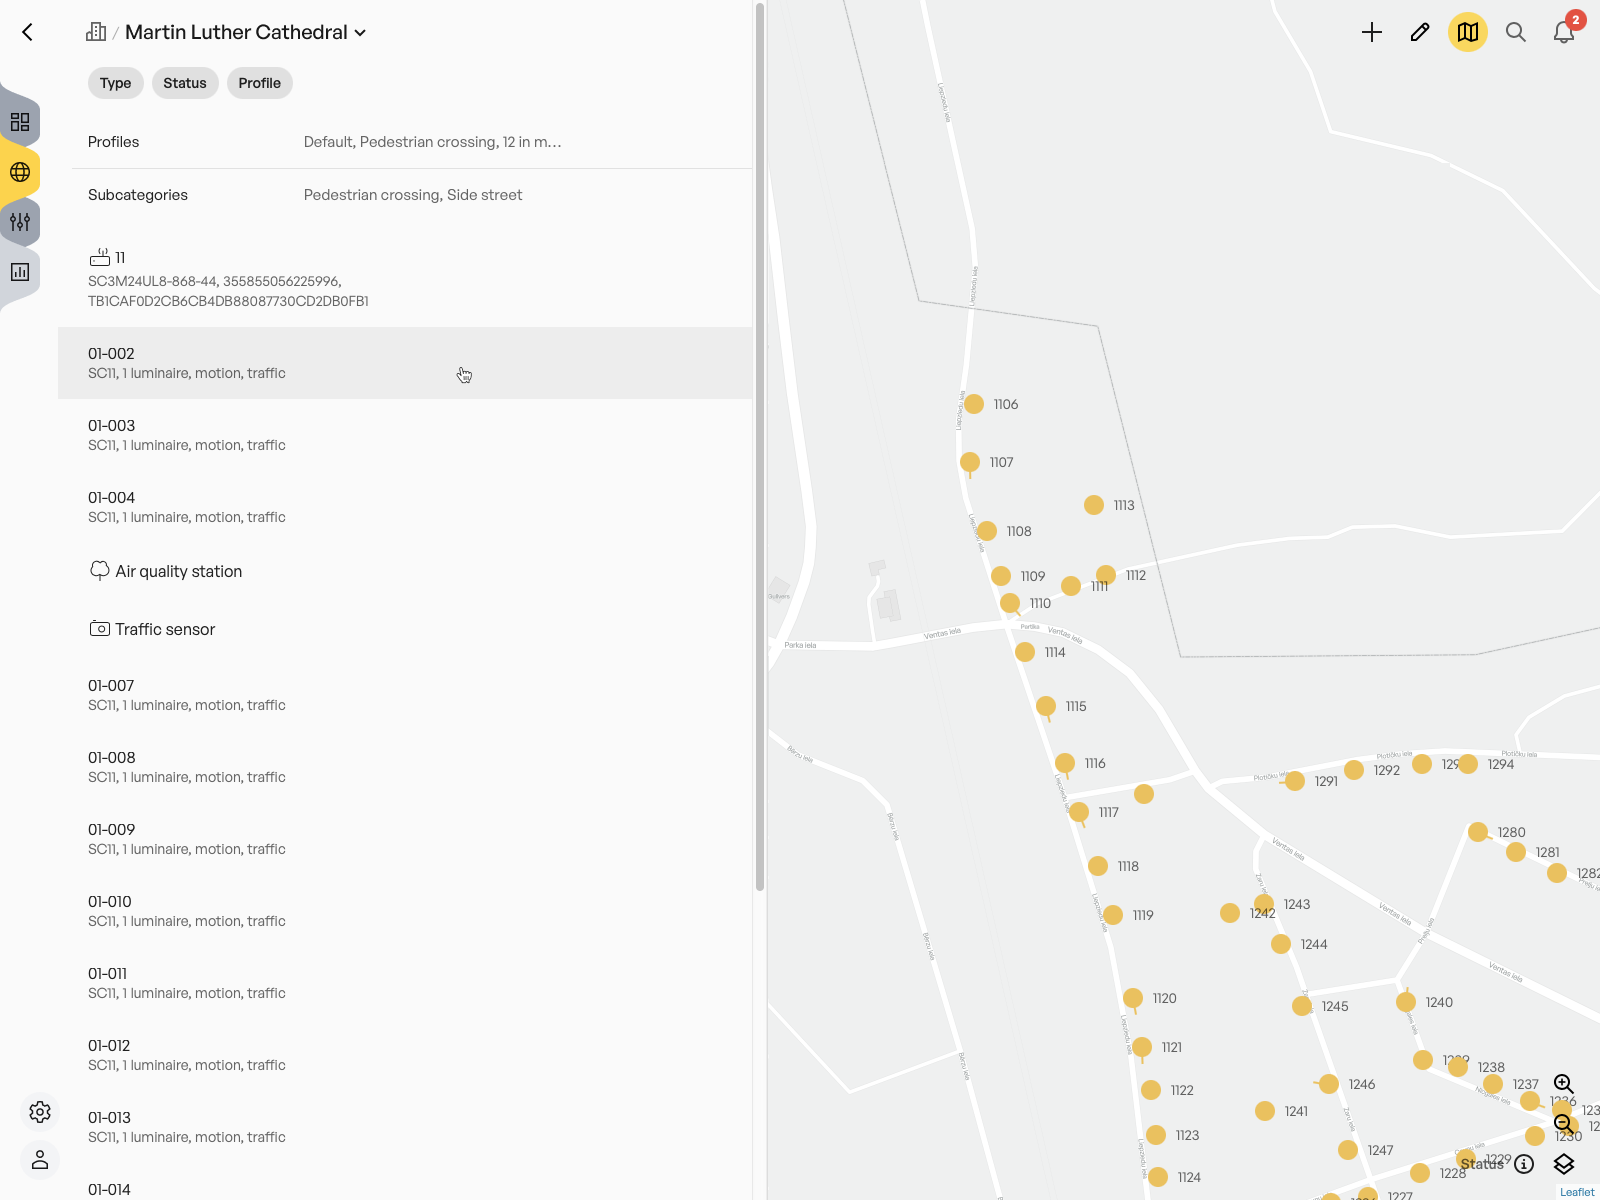
The system offers dual visualization of street lights – both as an organized hierarchical list and on an interactive map. Each display method provides real-time status monitoring to accommodate different user needs.
Unlike regular maps that emphasize roads and landmarks, lighting management maps prioritize the lighting infrastructure itself as the primary visual element. The base map is simplified to remove details irrelevant to lighting management.
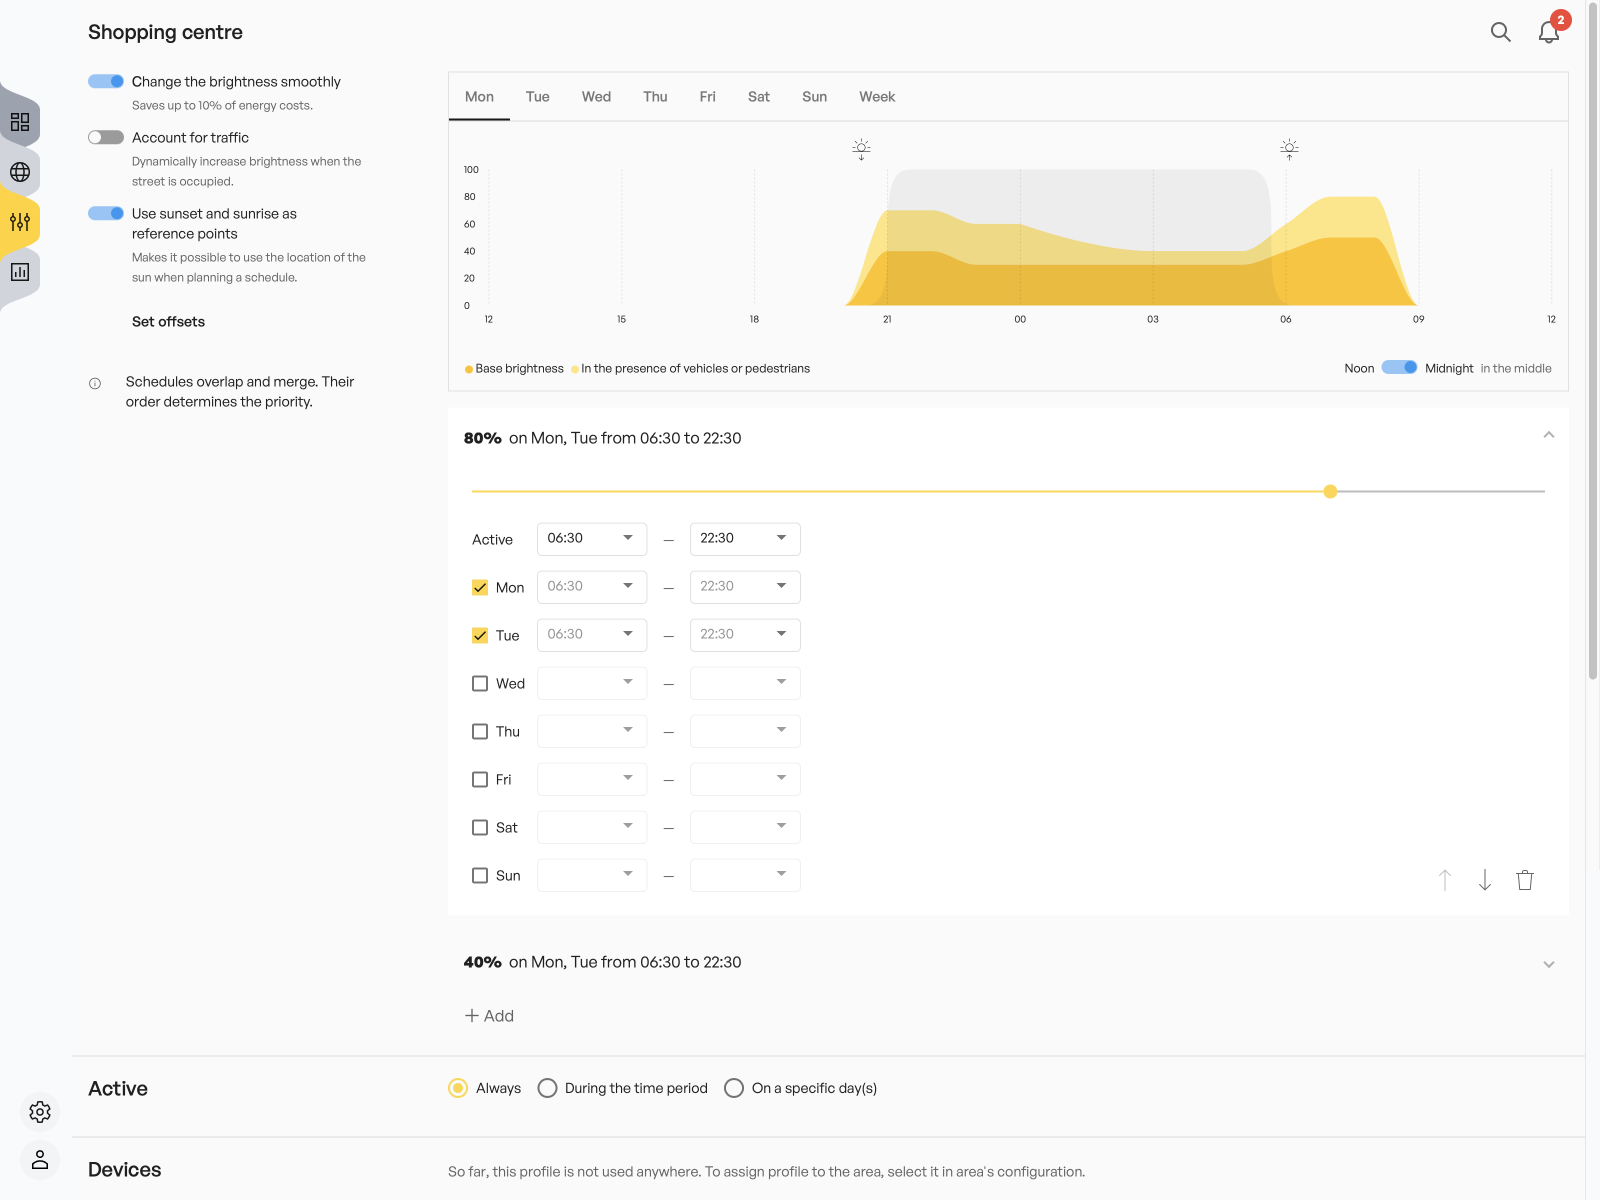
Adaptive brightness schedules automatically adjust illumination levels based on time of day, season, local sunset/sunrise times, and amount of traffic. Custom dimming patterns can be set for different urban zones (residential, commercial, industrial, parks). Energy consumption parameters set the maximum and minimum power thresholds based on municipal policies. Profile can also represent a special event override for temporary lighting requirements (festivals, emergencies, construction).
Profiles are created and managed independently, then assigned to specific areas or individual devices, ensuring they can be reused across multiple locations.
Practical experience with sensors, connectivity options, power constraints, and data management in real-world Internet of Things applications.
Insights into designing solutions that can scale from small pilot projects to citywide implementations.
Designing for products with 10+ year lifespans, including maintainability, durability, and future upgradability.